
Abstract
Coastal erosion is widespread under conditions of changing hydrodynamics and diminishing sediment supply, and exposure assessment to erosion hazard has received increasing attention. In this study, we explore the impact of spatial heterogeneity of land use within administrative units on exposure assessment of land use value to erosional hazard.
We illustrate land use diversity using the Shannon’s diversity index (SHDI) and consider the distance effect by comparing five different buffer zones according to the distance to the coast (i.e., 0–1 km, 0–2 km, 0–3 km, 0–4 km, 0–5 km). Our results show that coastline change and socio-economic development are responsible for land use heterogeneity within the administrative units. Using a buffer zone of 1-km along the coast as the assessment unit leads to an increase in the number of townships that have high and very high exposure of land use value when compared with the assessment result that is based on the whole township area.
Furthermore, the 1-km buffer zone can be divided into subunits if very high SHDI values exist within the administrative boundary. This study demonstrates that heterogeneity in land use identified at a fine spatial scale should be given full consideration in carrying out exposure assessment to hazards in a dynamic deltaic coast.
Introduction
Due to their abundant resources, deltas are often densely distributed with population and assets, which are especially true for developing countries in Asia (Seto 2011). However, the deltaic coast is extremely dynamic owing to varying sediment supplies and hydrodynamics, resulting in either coastline progradation or retreat (Tessler et al. 2015). When erosion occurs, it generally leads to migration of population, relocation of houses, and substantial economic loss along the coast (Syvitski et al. 2009; Szabo et al. 2016; Lam et al. 2018b). Under the current condition of global reduction of fluvial sediment load and relative sea-level rise, there exists an increasing erosion risk for the deltaic coast.
An example is the Mississippi River Delta where the wetland loss of ca. 5,000 km2 occurred since the 1930s, which has exerted an adverse impact on the local economic development (Couvillion et al. 2017). Historically, the Yangtze River Delta has experienced frequent coastal erosion and land loss. For example, the northern bank of North Branch has lost land of 217 km2 during 1916–1979, while the coastline retreated 3.7–5.0 km with a maximum retreating rate of 270 m/yr (1950–1954) (Feng et al. 1992).
To manage coastal hazards effectively, exposure assessment of population, land use, and assets has drawn great attention. In comparison to studies on exposure to flooding hazard (Hanson et al. 2010; Kebede and Nicholls 2011; Aerts et al. 2013; Hallegatte et al. 2013; Hinkel et al. 2014; Paprotny and Terefenko 2016; Vafeidis et al. 2019), exposure to erosion hazard receives much less attention (Fraser et al. 2017; Fitton et al. 2018). Nevertheless, these studies point to the importance of spatial scale. For management purpose, the finer the scale, the more useful the assessment result (Fekete et al. 2009; Li et al. 2015; Wolff et al. 2016).
In practice, the assessment is usually based on existing administrative units because of easy access of census data such as population, income, and educational level (Boruff et al. 2005; Szlafsztein and Sterr 2007; Ge et al. 2013; Chen et al. 2014). In China, the administrative units are based on a three-tier system, which are province, county, and township (Wang et al. 2021). For example, Luo et al. (2013) used the county-level administrative region along the southeast coast of Fujian Province as the assessment unit and calculated the proportion of agricultural to non-agricultural population as the indicator of land use/cover to assess coastal erosion risk. Roy et al. (2021) used the smallest administrative unit to assess coastal erosion risk in the Meghna Estuary of Bangladesh by using agricultural land area as the land use indicator.
However, using an administrative unit as the unit for exposure assessment from coastal erosion may not be accurate enough because of the spatial heterogeneity of land use within an administrative unit. Considering that impact of erosion hazard has a distance effect which decreases with increasing distance to the coast (Liquete et al. 2013; Kantamaneni et al. 2018; Williams et al. 2018), it is necessary to develop a methodology to capture the distance effect on heterogeneous land use patterns for accurate exposure assessment within an administrative unit.
In this paper, we explore the spatial heterogeneity of land use within townships along the coast of the Yangtze River Delta, and study its linkage to coastline dynamics and human use history. Then we use buffer zone analysis to consider the distance effect on land-use exposure assessment to erosion hazard within each township. For townships which show significant heterogeneity within 1 km distance to the coast, we further subdivide the assessment unit along the shore. The hierarchical analysis methodology presented in this paper could be applicable to assessing delta environments elsewhere.
Study area and methods
The Yangtze River Delta is formed by the third-largest river in the world, which is a typical tide-dominated delta (Chen et al. 1988). The delta has a long history of human settlement and agricultural activities, which can be dated back to 2,000 years ago. Due to its unique geographical location connecting the Yangtze River Basin and the ocean, industry and trade have developed rapidly especially in the past 100 years, which has supported the development of mega-city Shanghai and other cities along the coast (Fig. 1). As a result, this region is the most developed coastal area in China, with 2.3% of the land area generating for nearly 20.3% of China’s Gross Domestic Product (GDP) (National Bureau of Statistics of China 2021).
Fig. 1
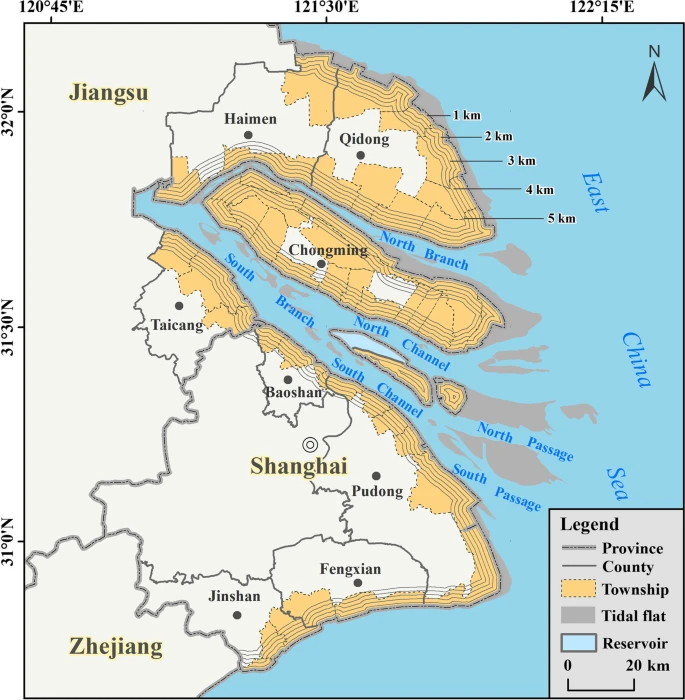
Map showing the Yangtze River Delta and administrative boundaries of Jiangsu Province and Shanghai, and their counties along the coast. The dashed line marks the boundaries of 49 townships. The gray lines mark the boundary of five buffer zones whose distance to the coastline ranges from 1 to 5 km. Administrative boundaries were publicly available via the map website (http://map.ps123.net); Basemap from the marine chart of the Yangtze River Delta in the 2010s (Maritime Safety Administration of People’s Republic of China 2013–2017); The map was created in ESRI ArcGIS
The coastline of the Yangtze River Delta has been subjected to erosion frequently in the historical period due to migrations of distributary channels and attack by storm surges, tides, and waves (Chen et al. 1988). Therefore, embankments were built more than 1,000 years ago to resist erosion in addition to flood control (Zhang et al. 1998).
Since 1950, due to the expansion of urban population and shortage of land for food production, tidal flats along the Yangtze River Delta have been extensively reclaimed, which has led to accelerated land gain (Li et al. 2019). Changes in morphology of the coastline further changes the hydrodynamic characteristics of the delta, which in turn affects the coastline stability. Before the 1980s, the reclaimed tidal flat was mainly used for agriculture. Since the 1980s, rapid economic development has led to increasing use of the land for the harbor, industrial activities, and infrastructure construction.
In this study, 49 administrative townships in Qidong, Haimen, and Taicang counties of Jiangsu Province and Chongming, Baoshan, Pudong, Fengxian, and Jinshan districts (equivalent to counties) of Shanghai, were selected for this study.
Spatial heterogeneity of land use
The spatial pattern of land use in each township along the Yangtze River Delta was obtained from Wang et al. (2021). The pattern was visually interpreted from the Landsat 2019 World Imagery (available from ArcGIS Online) with a pixel resolution of 1 m. Land use types were divided into 10 categories according to China’s land use classification standard, which include agriculture, industrial, tourism, aquaculture, airport, municipal utilities, construction, river, lake, and unused land (National Standard of the People’s Republic of China 2011). We used the Shannon’s diversity index (SHDI) to describe the heterogeneity of landscape distribution (Tang et al. 2008).
The theoretical minimum of SHDI is zero, but there is no fixed maximum value, as it depends on the number of species (land use types) in the analysis. When the SHDI equals zero, it means that there is only one type of land use. The larger the SHDI is, the more diverse the land use types, implying the higher the heterogeneity, and vice versa. For environmental data, the Shannon diversity index’s range of values is usually 1.5–3.5 (Ortiz-Burgos 2016).
Other fragmentation indices could be used, such as the fractal dimension, which has been used to evaluate the landscape fragmentation of the Mississippi River Delta and its correlation with land loss (Lam et al. 2018b). The SHDI values of 49 townships were calculated as follows:
𝑆𝐻𝐷𝐼=−∑𝑖=1𝑚(𝑃𝑖∗ln𝑃𝑖)SHDI=−∑i=1m(Pi∗lnPi)
where m is the number of land-use types within each township; 𝑝𝑖pi is the proportion of the area of land-use type 𝑖i to the total area of its townships. Since the SHDI values follow a normal distribution, the standard deviation (Std. Dev.) method (Yoon, 2012) was used to divide the SHDI into three categories, namely low (< -0.50 Std. Dev.), medium (-0.50—0.50 Std. Dev.) and high (> 0.50 Std. Dev.) diversity.
Exposure assessment of land use based on buffer zone analysis
Given that the average distance covered by coastal townships is about 5 km, this paper analyzes the land use pattern within five buffer zones with different distances to the coast, i.e., 0–1 km, 0–2 km, 0–3 km, 0–4 km and 0–5 km. It should be noted that the distance of the buffer zone is arbitrary considering the uncertainty in the influencing extent of erosion hazard (Lam et al., 2009; Muir et al. 2021). The main consideration of using 1 km as the interval in this study is that coastline erosion rate is on the magnitude of several tens of meter per year (e.g., Feng et al. 1992) and a time span of ~ 100 years for the typical lifetime of infrastructure (National Standard of the People’s Republic of China 2018).
Meanwhile, current industrial or built land use along the coast is mostly within a distance of 0–1 km to the coastline. For each buffer zone within a township, we followed the method of assessing land use exposure in township as described in Wang et al. (2021). According to the socio-economic value of land use and population, land use types were divided into five levels as follows: very low (unused), low (river, lakes), moderate (aquaculture land, agriculture land), high (tourism land, industrial land), and very high value (airport land, municipal utilities, urban construction land) (Yin et al. 2012; Li et al. 2015).
Each level was designated to 1, 2, 3, 4, and 5 respectively, and the total score of land use value within the five buffer zones were weighted summed according to the area ratio of each land use type. The higher the land use value, the greater the land use exposure. The standard deviation method was used to divide the total land use value score into five classes, which are very low (< -1.5 Std. Dev.), low (-1.5—-0.5 Std. Dev.), moderate (-0.5—0.5 Std. Dev.), high (0.5—1.5 Std. Dev.) and very high (> 1.5 Std. Dev.) exposure.
Considering that the 0–1 km buffer zone being the most sensitive to erosion hazard, we further calculated the SHDI values for this zone to illustrate the heterogeneity in the alongshore direction and classify into three levels similar to the method discussed in Sect. 1.2.
Coastline change and socio-economic development
The coastline change of the Yangtze River Delta was derived from the 1958 marine chart and the 2021 Landsat-8 remote sensing image. Landsat-8 Operational Land Imager (OLI) remote-sensing images in 2021 with a resolution of 30 m were downloaded for free from the USGS website (https://earthexplorer.usgs.gov). We preprocessed the Landsat images with radiometric calibration, atmospheric correction, and geometric correction in ENVI 5.3 to ensure an accurate extraction of the coastline.
Since the coast has been embanked with seawalls, we use the location of the seawall as the shoreline, which can be identified easily from the chart as well as the Landsat images. In ArcGIS 10.5, the shoreline Locations of the two years (1958 and 2021) were visually interpreted, and the End Point Rate of the Digital Shoreline Analysis System software (DSAS v5.0) was used to calculate the shoreline change distance and rate between 1958 and 2021. To assess the coastal socio-economic development, population and GDP data of the counties to which the townships are belonged were collected for the period between 1990 and 2019 using a five-year interval (National Bureau of Statistics 1991–2020).
Results
Land use type and spatial heterogeneity
In 2019, Land use type was dominated by agricultural land along the coast of Qidong, Haimen, Chongming and part of Fengxian, whereas industrial and urban use were the major land use types along the coast of Taicang, Baoshan, Pudong, and Jinshan (Fig. 2). In general, land use type changes from agricultural to industrial/urban use with decreasing distance to the coast.
Fig. 2
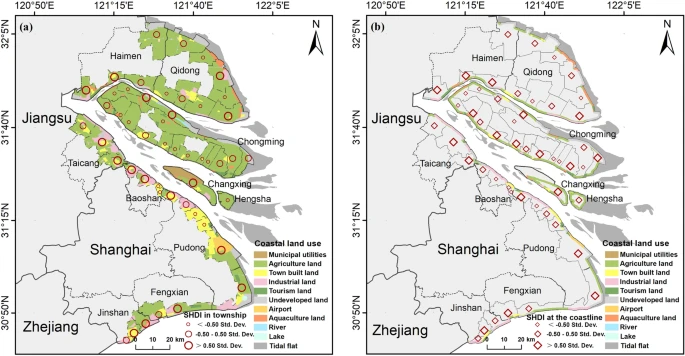
Spatial pattern of land use types and levels of Shannon’s diversity index (SHDI) of the whole township (a) and 0–1 km buffer zone (b) along the coast of the Yangtze River Delta. The spatial pattern of land use of each township is from Wang et al. (2021); Administrative boundaries were available via the map website (http://map.ps123.net); Basemap from the marine chart of the Yangtze River Delta in the 2010s (Maritime Safety Administration of People’s Republic of China 2013–2017); The map was created in ESRI ArcGIS
Figure 2a shows that the SHDI values of the 49 townships ranged between 0 and 1.47. The low level of SHDI (0–0.47) indicates a more homogenized pattern of land use types, which accounts for 39% of the total number of townships. These townships are located mainly in Chongming. Medium and high levels of SHDI occupy 27% and 35%, respectively, of the total number of townships. They are located mainly in Haimen, Qidong, Taicang and the mainland of Shanghai (including Baoshan, Pudong, Fengxian and Jinshan).
Within the 0–1 km buffer zone, the SHDI values of the 49 townships ranged between 0 and 1.40. SHDI values of the 0–1 km buffer zones highly positively correlate with the SHDI values calculated using the townships as the assessment unit (Fig. 3). Buffer zones with low SHDI level (0–0.44) are located in 28% of the townships, and they are mainly in Chongming, Baoshan, and Qidong. Medium and high levels of SHDI of the buffer zones are located in 34% and 38% of the townships, respectively (Fig. 2b). Clearly, proportion of medium and high levels of the SHDI values is higher in the 0–1 km buffer zone in comparison to the whole township.
Fig. 3
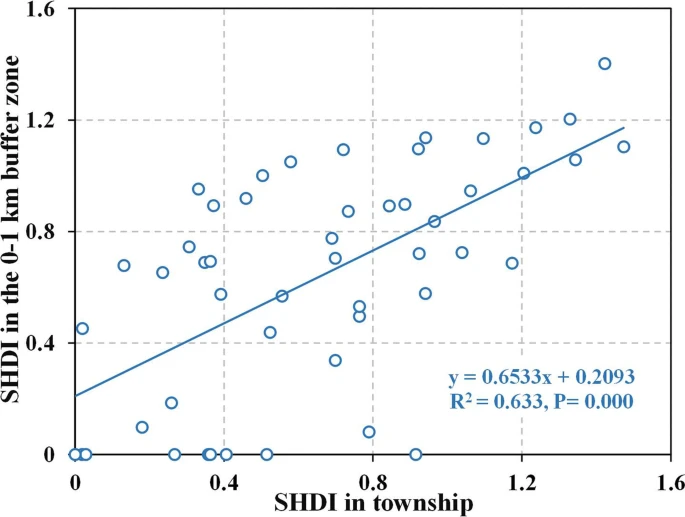
Pearson correlation analysis results between SHDI in township and SHDI in the 0–1 km buffer zone along the coastline
Variability of land use value class with distance to the coast
We observe four types of changes in land use value class in the study area (Figs. 4a-e), including no change (type I), increasing (type II), decreasing (type III) and fluctuating change (type IV) (Fig. 4g; Table 1). About 69% of the townships shows no changes in land use value class within the 5 km distance area. In a direction of increasing distance to the coast, increasing (type II) and decreasing (type III) land use exposure account for 27%. Type IV (fluctuating) accounts for the remaining 4%.
Fig. 4
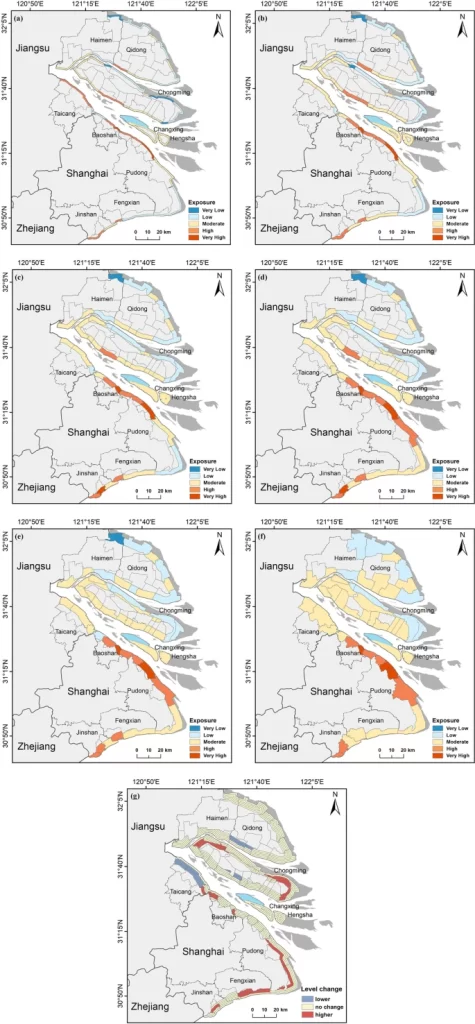
Variability of land use value class in different buffering zones with increasing distance to the coast (0–1, 0–2, 0–3, 0–4 and 0–5 km) (a-e) and the whole township area (f). Changes of land use value level in each buffer zone (0–2, 0–3, 0–4 and 0–5 km) in comparison to 0–1 km buffer zone are shown in (g). Map created in ESRI ArcGIS and boundary layer from the map website (http://map.ps123.net). Basemap from the marine chart of the Yangtze River Delta in the 2010s (Maritime Safety Administration of People’s Republic of China 2013–2017)
Table 1
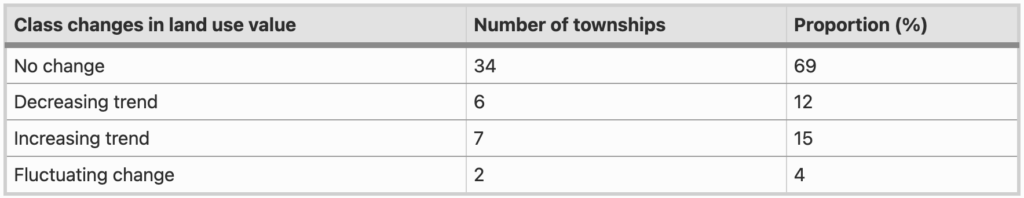
Class changes in land use value among the five buffer zones (i.e., 0–1, 0–2, 0–3, 0–4 and 0–5 km) according to comparison in direction with increasing distance to the coast
Comparison of land use value class of 0–1 km buffer zone with that of the whole township
When using the 0–1 km buffer zone as the assessment unit (Fig. 4a), we found that most of the townships (70%) did not change their land use value classes in comparison with that of the whole township (Fig. 4f, Fig. 5a, Table 2). Townships with lower land use value class amount to 18%. Based on the heterogeneity along the coast within the 0–1 km buffer zone (Fig. 2b), we further divided the 0–1 km buffer zones that have high SHDI values and lowered land use value class into sub-zones, i.e., townships labeled 1–3 in Fig. 5a. Township #1 was divided into two zones, while townships #2 and #3 three zones each. The resulting assessment leads to increased proportions of classes with higher exposure value (Fig. 5b). The increased length of coastal section with higher exposure value is 43.92 km in length, which amounts to 6.43% of the whole length of the studied coastline.
Fig. 5
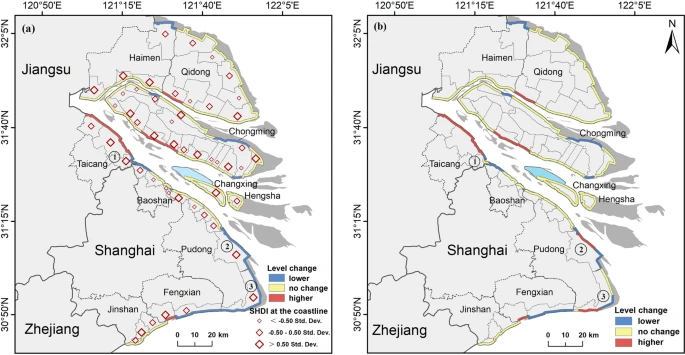
a Class change of land use value of 0–1 km buffer zone in comparison to assessment using the whole township. Since 0–1 km buffer zone within township #1–3 in (a) shows the high level of Shannon’s diversity index (SHDI), they are further sub-divided, resulting in more zones with higher class of land use value identified b. Map created in ESRI ArcGIS and boundary layer from the map website (http://map.ps123.net). Basemap from the marine chart of the Yangtze River Delta in the 2010s (Maritime Safety Administration of People’s Republic of China 2013–2017)
Table 2
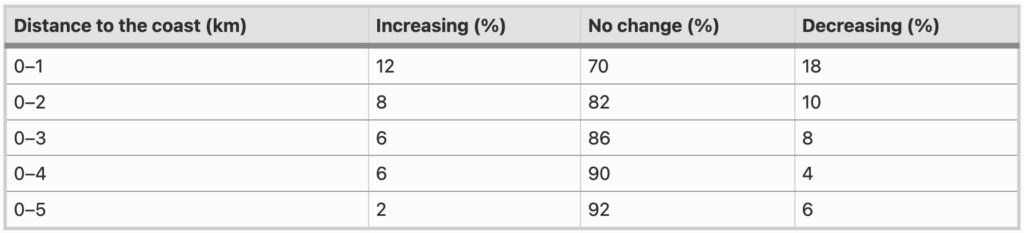
Class changes in land use value within different buffer zones against whole township area assessment
Coastline changes
A comparison of the studied coastline between 1958 and 2021 reveals that both advancement and retreat occurred in the study area (Fig. 6a). Coastline retreat occurs primarily in the northern bank of the North Branch, which belongs to Haimen and Qidong counties. The retreat distance ranged from 0 to 3670 m, with a mean rate of 15 m/yr and a maximum of 60 m/yr. The remaining study area experienced significant coastline advancement, especially along the northern and eastern bank of the Chongming Island and the southern coast of Pudong. The advancement distance ranged from 0 to 11,350 m, with a mean rate of 50 m/yr and a maximum of 183 m/yr. It should be noted that such an advancement of coastline is mainly caused by reclamation activities since the 1950s (Li et al. 2019).
Fig. 6
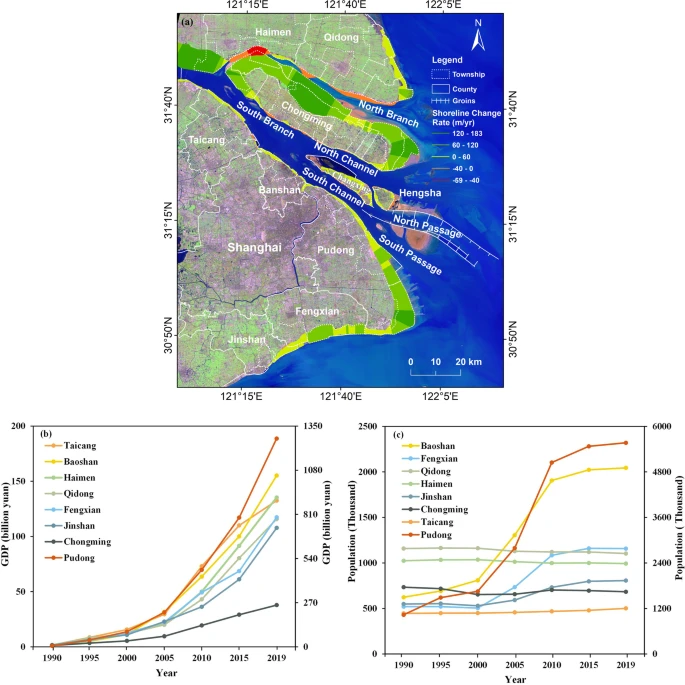
a Coastline change between 1958 and 2021 along the Yangtze River Delta. Different colors represent five classes of the rate of coastline change, with red and orange colors indicating coastal erosion. b GDP and c population changes (1990–2019) among the eight counties along the coast of the Yangtze River Delta.
In b and c, the vertical axis on the right represents GDP and population of Pudong, respectively, while that on the left represents GDP and population of the remaining seven counties (data from National Bureau of Statistics 1991–2020). The satellite map was freely acquired from the USGS website (https://earthexplorer.usgs.gov); Basemap from the marine chart of the Yangtze River Delta in the 2010s (Maritime Safety Administration of People’s Republic of China 2013–2017); Administrative boundaries are available via the map website (http://map.ps123.net). The map was created in ESRI ArcGIS and Microsoft Excel
Economic and population change
Land use along the coast is influenced by its economic development history and population change. In general, with increase in economic development and GDP, agricultural and unused land will likely change to urban or industrial land. Similarly, population growth and urbanization will lead to increase in construction land. The eight counties had similar GDP in 1990 and all showed GDP growth between 1990 and 2019, although with different trends (Fig. 6b).
Pudong had the most dramatic growth, while Chongming had the lowest GDP and growth rate. Among the three counties belonging to Jiangsu Province, Taicang had a higher GDP growth rate than Haimen and Qidong, but its growth rate slowed down after 2015. Population data (Fig. 6c) shows that all counties in Jiangsu Province and Chongming in Shanghai are relatively stable, while Pudong, Baoshan and Fengxian in Shanghai had rapid population growth, especially after the year 2000.
Discussion
Effect of coastline dynamics and socio-economic development on spatial pattern of land use
The Yangtze River is a large river with abundant sediment discharge. Population growth and soil erosion in the drainage basin over the last 2000 years have promoted quick coast advancement historically (Chen et al. 1988). Starting from 1950, with further increase of population in the Yangtze River basin, soil erosion becomes intensive and fluvial sediment discharge to the coast reaches a high value of 470 Mt/yr (1951–1985) (Changjiang Water Resources Commission 2021).
The deposition of sediment at the meso-tidal delta stimulates tidal flat development along the coast, with width of tidal flat varying according to localized fluvial-tidal interactions (Chen et al. 1988). Wider tidal flats are observed along the bank of flood-dominant distributary channel (e.g., northern bank of Chongming island along the North Channel) and the shallow shoals at the river mouth bar region (e.g., eastern end of Chongming Island and southern part of Pudong) (Fig. 1). These coasts with rapid tidal flat progradation have been reclaimed for agricultural or industrial use since 1950 due to rapid population growth and demand for food and industry (Fig. 6a).
For example, Chongming has seen a double in size growth since 1950 due to land reclamation (Li et al. 2019). However, the reclaimed lands in Chongming are used mainly for agricultural use, which is a result of multiple factors, including remote distance and poor transport connection to the center of Shanghai city and policy consideration by Shanghai City such as arable land reserve and restricted industrial development for ecological protection of the island. As a result, Chongming has a lower GDP and slow population growth over time (Fig. 6b).
The pressure of converting agricultural land to industrial land in Chongming is minor, and land use type remains unchanged with time, resulting in lower SHDI values in most of its townships (Fig. 2a). In contrast, the coastline of southern Pudong changed little until 1995, after which dramatic reclamation occurred with a land gain rate of 35 km2/yr during 2002–2005 (Xu and Chen 2011). These reclaimed lands are used for urban expansion and infrastructure such as airport, as Pudong has been designated as a new key urbanization area in Shanghai since 1990 (Fig. 6b). Former agricultural land in rural area has been transformed into industrial or urban use, generating large diversity in land use type within the 5 km distance to the coast (Fig. 2a).
For those coasts that have limited tidal flat development and land reclamation (Fig. 1), development of industry and harbors use requires stable coastline and access to deep water for shipping of raw materials and products. The petrochemical industry in Jinshan and steel plants in Baoshan along the industrialized coastline has resulted in larger SHDI values (Fig. 2a). Finally, Haimen and Qidong were traditionally rural areas with a predominance of agriculture similar to Chongming. However, these counties have experienced rapid GDP growth (Fig. 6b), and part of their coastline has seen a conversion of agricultural to a variety of industrial/urban land and therefore larger SHDI values (Fig. 2a).
Distance based exposure assessment of land use value
Exposure assessment is to identify people, land use, or assets affected by hazards such as flooding and erosion. For the hazards that have occurred, it is easy to assess the exposure. However, regarding future hazards, we have to rely on various modeling approaches such as process-based modeling to forecast the impact of hazards under different scenarios (e.g., Luan et al. 2017; Dastgheib et al. 2018). Such models would require a better understanding of all the forcings of hazards and their complex interactions, which has large uncertainty.
The performance of the forecasting models would also depend on the accuracy and spatial/temporal resolution of input data. Under the condition of insufficient data, it is difficult for these models to produce reliable results (Wolff et al. 2016; Dastgheib et al. 2018; Hinkel et al. 2021). Alternatively, some studies use administrative unit to assess exposure given easy access of census data (Luo et al. 2013; Roy et al. 2021). However, this method may not fully capture the real influence of hazards.
Considering that exposure to hazard is distance-dependent, we use buffer zone analysis to carry out exposure of land use to erosion hazard. The data are easy to obtain, the calculation is straightforward, and it is convenient to compare the exposure assessment results under scenarios with different spatial extents.
Regarding the assessment of land use value, there are two methods. The first one is to identify a market value for each land use type. This method can determine the real value of each land use type exposed to hazard. However, this method only represents the approximate value of each land use type, which is highly heterogeneous in space depending on the environmental conditions (Ward et al. 2010; Fitton et al. 2018; Armstrong and Lazarus 2019).
The second method is to assign each land use type a relative value level (Aucelli et al. 2018; Roy et al. 2021). The advantage is that the method is straightforward and easy to apply to other study areas. The disadvantage is the lack of consideration of the real value loss of land use. Considering the complexity and uncertainty of land use market value estimation, this study used the value level method to evaluate the land use exposure, which can quickly identify the areas with high exposure and is convenient for further detailed studies on loss estimation if required.
Using areas within 1 km to the coast as the assessment unit will lead to more townships that have increase in land use value class (12% of the total townships) when compared with the result of using the whole township as the assessment unit (Fig. 4f; Table 2). If the distance is increased to 2 km, the townships with increased land use value will become 8% of the total townships. This is caused by the fact that the townships along the coast of the Yangtze River delta are remote from the city center of Shanghai and therefore are largely agriculture dominated before the 1990s. Recent economic growth since 1990s has led to an increased use of coastal frontage by industrial and urban activities.
As distance to the coastline becomes larger (i.e., larger buffer area), proportion of townships with higher class of land use value becomes lower because of more agricultural use (Table 2). Considering the historical retreat rate of coastline in the study area (e.g., Feng et al., 1992), a time span of ca. 100 years for urban plan or adapting to climate change, and current spatial extent of land use along the coastline, we suggest that a buffer area within 1 km distance to the coast is favored over the administrative unit of township, with the latter neglecting the spatial heterogeneity of land use within a township.
It should be noted that studies addressing coastal erosion and governmental management have proposed different distances to the coastline as the buffer zones or setback areas, depending on the local physical and social-economical settings (e.g., OEH 2017; Williams et al. 2018; Muir et al. 2021). Nevertheless, the possible coastline change rate and the time span of management consideration are the two major factors in selecting the buffering distance to the coastline (Fraser et al. 2017). Such a scale effect has also been demonstrated to be significant in exposure assessment of coastal flooding hazard (Wolff et al. 2016).
When taking the 0–1 km buffer zone as the assessment unit for each township, the results show heterogeneity of land use types and therefore changes in land use value within the boundary of a township (Fig. 2b). The positive relationship between SHDI values of 0–1 km buffer zones and that of the township (Fig. 3) indicates that townships with greater heterogeneity of land use are not only occurring in the direction perpendicular to the coast, but also along the coast.
If neglecting such a variability, then part of the 0–1 km buffer zone will show lowered class of exposure value against the whole town assessment, e.g., townships labeled 1–3 in Fig. 5a. By considering such a heterogeneity, coastal sections with higher land use value exposure can be identified (Fig. 5b). It again demonstrates that finer spatial scale should be used in areas with higher diversity of land use.
The above analysis indicates that administrative unit has advantages in exposure assessment due to access of census data and practical use in management. However, in the coastal area showing dramatic environmental changes caused by physical or social factors, landscape diversity should be properly considered. This is reflected both in the direction perpendicular and parallel to the coast. Since there exists uncertainty in forecasting future hazards and their influencing area, for a precautionary risk analysis, such a hierarchical process of combining administrative units with buffer zone analysis has advantages in exposure assessment to coastal hazards including erosion and floods.
In this study, we consider only the current pattern of land use and its value class. Considering future economic development, it is anticipated that land use will change along the coast. Change of land use value can be speculated from regional GDP growth rate and their link to land use. For the study area, we can also refer to the land use planning formulated every 5 years by the government (Shanghai Municipality 2019). With such envisioned land use in the future, exposure of land use under future erosion hazard can be calculated, which can support regional planning of the coast in terms of erosion risk.
Conclusions
We offered a hierarchical method of combining administrative units with buffer zone analysis to assess land use exposure to erosion hazard using the Yangtze River Delta as an example. Land use within administrative townships is spatially heterogeneous according to our analysis using the Shannon’s diversity index (SHDI). Coasts with rapid progradation of tidal flats have been impacted by land reclamation and resulted in land gain since 1950 in the study area.
Depending on the level of socio-economic development and territorial planning, many of the coastal townships were dominant in agricultural use before 1990 but changed to industrial/urban land after 1990. In consideration of the distance effect of erosion hazard, we used areas within 1 km to the coast as the assessment unit and found more townships having an increased exposure of higher land use value class when compared with the result of using the whole township as the assessment unit.
Furthermore, the 0–1 km buffer zone can be further divided into subzones if land use is highly heterogeneous within the boundary of administrative township. In summary, a whole-township based assessment will underestimate the exposure of land use value to erosion hazard. This study demonstrates that distance effect and high-spatial resolution analysis should be given full consideration in carrying out exposure assessment to coastal hazards in a heterogeneous and dynamic deltaic coast.
Availability of data and materials
The first author, Ms. Xiaoting Wang can be contacted for access to the data.
References
- Aerts JC, Lin N, Botzen W, Emanuel K, de Moel H (2013) Low-probability flood risk modeling for New York City. Risk Anal 33(5):772–788. https://doi.org/10.1111/risa.12008
- Armstrong SB, Lazarus ED (2019) Reconstructing patterns of coastal risk in space and time along the US Atlantic coast, 1970–2016. Nat Hazards Earth Syst Sci 19(11):2497–2511. https://doi.org/10.5194/nhess-19-2497-2019
- Aucelli PPC, Di Paola G, Rizzo A, Rosskopf CM (2018) Present day and future scenarios of coastal erosion and flooding processes along the Italian Adriatic coast: The case of Molise region. Environ Earth Sci 77(10):371. https://doi.org/10.1007/s12665-018-7535-y
- Boruff BJ, Emrich C, Cutter SL (2005) Erosion hazard vulnerability of US coastal counties. J Coast Res 215:932–942. https://doi.org/10.2112/04-0172.1
- Changjiang Water Resources Commission (2021) Changjiang Sediment Bulletin. Changjiang Press, Wuhan (in Chinese)
- Chen J, Shen H, Yu C (1988) Processes of Dynamics and Geomorphology of the Changjiang Estuary. Shanghai Scientific and Technical Publishers, Shanghai (in Chinese)
- Chen W, Cutter SL, Emrich CT, Shi P (2014) Measuring social vulnerability to natural hazards in the Yangtze River Delta region, China. Int J Disaster Risk Sci 4(4):169–181. https://doi.org/10.1007/s13753-013-0018-6
- Couvillion BR, Beck H, Schoolmaster D, Fischer M (2017) Land Area Change in Coastal Louisiana (1932 to 2016): Technical report scientific investigations maps. U.S. Geological Survey, Reston.
- Dastgheib A, Jongejan R, Wickramanayake M, Ranasinghe R (2018) Regional scale risk-informed land-use planning using probabilistic coastline recession modelling and economical optimisation: East Coast of Sri Lanka. J of Mar Sci Eng 6(4):120. https://doi.org/10.3390/jmse6040120
- Fekete A, Damm M, Birkmann J (2009) Scales as a challenge for vulnerability assessment. Nat Hazards 55(3):729–747. https://doi.org/10.1007/s11069-009-9445-5
- Feng X, Han Z, Huang J (1992) Riverbank and coastline changes in Nantong area during the last forty years – Erosion and silting of riverbank and coast. Mar Geol Q Geol 12(2):65–77 (in Chinese)
- Fitton JM, Hansom JD, Rennie AF (2018) A method for modelling coastal erosion risk: The example of Scotland. Nat Hazards 91(3):931–961. https://doi.org/10.1007/s11069-017-3164-0
- Fraser C, Bernatchez P, Dugas S (2017) Development of a GIS coastal land-use planning tool for coastal erosion adaptation based on the exposure of buildings and infrastructure to coastal erosion, Québec. Canada Geomat Nat Hazards Risk 8(2):1103–1125. https://doi.org/10.1080/19475705.2017.1294114
- Ge Y, Dou W, Gu Z, Qian X, Wang J, Xu W, Shi P, Ming X, Zhou X, Chen Y (2013) Assessment of social vulnerability to natural hazards in the Yangtze River Delta, China. Stoch Environ Res Risk Assess 27(8):1899–1908. https://doi.org/10.1007/s00477-013-0725-y
- Hallegatte S, Green C, Nicholls RJ, Corfee-Morlot J (2013) Future flood losses in major coastal cities. Nat Clim Chang 3(9):802–806. https://doi.org/10.1038/nclimate1979
- Hanson S, Nicholls R, Ranger N, Hallegatte S, Corfee-Morlot J, Herweijer C, Chateau J (2010) A global ranking of port cities with high exposure to climate extremes. Clim Change 104(1):89–111. https://doi.org/10.1007/s10584-010-9977-4
- Hinkel J, Feyen L, Hemer M, Le Cozannet G, Lincke D, Marcos M, Mentaschi L, Merkens JL, de Moel H, Muis S, Nicholls RJ, Vafeidis AT, van de Wal RSW, Vousdoukas MI, Wahl T, Ward PJ, Wolff C (2021) Uncertainty and bias in global to regional scale assessments of current and future coastal flood risk. Earths Future 9(7):1–28. https://doi.org/10.1029/2020EF001882
- Hinkel J, Lincke D, Vafeidis AT, Perrette M, Nicholls RJ, Tol RS, Marzeion B, Fettweis X, Ionescu C, Levermann A (2014) Coastal flood damage and adaptation costs under 21st century sea-level rise. Proc Natl Acad Sci U S A 111(9):3292–3297. https://doi.org/10.1073/pnas.1222469111
- Kantamaneni K, Phillips M, Thomas T, Jenkins R (2018) Assessing coastal vulnerability: Development of a combined physical and economic index. Ocean Coast Manag 158:164–175. https://doi.org/10.1016/j.ocecoaman.2018.03.039
- Kebede AS, Nicholls RJ (2011) Exposure and vulnerability to climate extremes: Population and asset exposure to coastal flooding in Dar es Salaam, Tanzania. Reg Environ Change 12(1):81–94. https://doi.org/10.1007/s10113-011-0239-4
- Lam NSN, Arenas H, Li Z, Liu KB (2009) An estimate of population impacted by climate change along the U.S. coast. J Coastal Res, Special Issue 56:1522–1526. https://doi.org/10.2307/25738044
- Lam NSN, Cheng W, Zou L, Cai H (2018a) Effects of landscape fragmentation on land loss. Remote Sens Environ 209:253–262. https://doi.org/10.1016/j.rse.2017.12.034
- Lam NSN, Xu Y, Liu K-B, Dismukes D, Reams M, Pace R, Qiang Y, Narra S, Li K, Bianchette T, Cai H, Zou L, Mihunov V (2018b) Understanding the Mississippi River Delta as a coupled natural-human system: Research methods, challenges, and prospects. Water 10(8):1054. https://doi.org/10.3390/w10081054
- Li J, Jiang C, Liu Q, Zhao J (2019) Water and Sediment Transport and Riverbed Evolution in the Yangtze River Estuary. Science Press, Beijing (in Chinese)
- Li X, Zhou Y, Tian B, Kuang R, Wang L (2015) GIS-based methodology for erosion risk assessment of the muddy coast in the Yangtze Delta. Ocean Coast Manag 108:97–108. https://doi.org/10.1016/j.ocecoaman.2014.09.028
- Liquete C, Zulian G, Delgado I, Stips A, Maes J (2013) Assessment of coastal protection as an ecosystem service in Europe. Ecol Indic 30:205–217. https://doi.org/10.1016/j.ecolind.2013.02.013
- Luan HL, Ding PX, Wang ZB, Ge JZ (2017) Process-based morphodynamic modeling of the Yangtze Estuary at a decadal timescale: Controls on estuarine evolution and future trends. Geomorphology 290:347–364. https://doi.org/10.1016/j.geomorph.2017.04.016
- Luo S, Wang H, Cai F (2013) An integrated risk assessment of coastal erosion based on fuzzy set theory along Fujian coast, southeast China. Ocean Coast Manag 84:68–76. https://doi.org/10.1016/j.ocecoaman.2013.07.007
- Maritime Safety Administration of People’s Republic of China (2013–2017) The Marine Chart of the Yangtze River Delta in the 2010s. China Communications Press, Beijing (in Chinese)
Muir FME, Hurst MD, Rennie AF, Hansom JD (2021) Dynamic Coast: National Coastal Erosion Risk Assessment. CRW2017_08. Scotland’s Centre of Expertise for Waters (CREW), England - National Bureau of Statistics (1991–2020) Statistical Yearbook (Shanghai and Jiangsu). Bureau of Statistics, Shanghai (in Chinese)
- National Standard of the People’s Republic of China (2011) Code for Classification of Urban Land Use and Planning Standards of Development Land (50137). Ministry of Housing and Urban-Rural Development of the People’s Republic of China, Beijing (in Chinese)
- National Bureau of Statistics (2021) China Statistical Yearbook 2021. China Statistics Press, Beijing (in Chinese)
- National Standard of the People’s Republic of China (2018) Unified Standard for Reliability Design of Building Structures (50068). Ministry of Construction of the People’s Republic of China, Beijing (in Chinese)
- Office of Environment and Heritage (OEH) (2017) Coastal Erosion in New South Wales: Statewide Exposure Assessment. Office of Environment and Heritage, Sydney
- Ortiz-Burgos S (2016) Shannon-Weaver Diversity Index. In: Kennish M.J. (eds) Encyclopedia of Estuaries. Encyclopedia of Earth Sciences Series. Springer, Dordrecht. https://doi.org/10.1007/978-94-017-8801-4_233
Paprotny D, Terefenko P (2016) New estimates of potential impacts of sea level rise and coastal floods in Poland. Nat Hazards 85(2):1249–1277. https://doi.org/10.1007/s11069-016-2619-z - Roy S, Pandit S, Papia M, Rahman MM, Ocampo JCOR, Razi MA, Fraile-Jurado P, Ahmed N, Al-Amin Hoque M, Hasan MM, Yeasmin J, Hossain MS (2021) Coastal erosion risk assessment in the dynamic estuary: The Meghna estuary case of Bangladesh coast. Int J Disaster Risk Reduct 61:102364. https://doi.org/10.1016/j.ijdrr.2021.102364
- Seto KC (2011) Exploring the dynamics of migration to mega-delta cities in Asia and Africa: Contemporary drivers and future scenarios. Glob Environ Change 21:S94–S107. https://doi.org/10.1016/j.gloenvcha.2011.08.005
- Shanghai Municipality (2019) General Territorial and Spatial Plan of Pudong New Area, Shanghai, 2017–2035. Shanghai Municipal Bureau of Planning and Natural Resources, Shanghai (in Chinese)
Syvitski J, Kettner AJ, Overeem I, Hutton E, Nicholls RJ (2009) Sinking Deltas due to Human Activities. Nat Geosci 2(10):681–686. https://doi.org/10.1038/NGEO629 - Szabo S, Brondizio E, Renaud FG, Hetrick S, Nicholls RJ, Matthews Z, Tessler Z, Tejedor A, Sebesvari Z, Foufoula-Georgiou E, da Costa S, Dearing JA (2016) Population dynamics, delta vulnerability and environmental change: Comparison of the Mekong, Ganges-Brahmaputra and Amazon delta regions. Sustain Sci 11(4):539–554. https://doi.org/10.1007/s11625-016-0372-6
- Szlafsztein C, Sterr H (2007) A GIS-based vulnerability assessment of coastal natural hazards, state of Pará. Brazil J Coast Conserv 11(1):53–66. https://doi.org/10.1007/s11852-007-0003-6
- Tang J, Wang L, Zhang S (2008) Investigating landscape pattern and its dynamics in Daqing. China Int J Remote Sens 26(11):2259–2280. https://doi.org/10.1080/01431160500099410
- Tessler ZD, Vörösmarty CJ, Grossberg M, Gladkova I, Aizenman H, Syvitski JPM, Foufoula-Georgiou E (2015) Profiling risk and sustainability in coastal deltas of the world. Science 349(6248):638–643. https://doi.org/10.1126/science.aab3574
- Vafeidis AT, Schuerch M, Wolff C, Spencer T, Merkens JL, Hinkel J, Lincke D, Brown S, Nicholls RJ (2019) Water-level attenuation in global-scale assessments of exposure to coastal flooding: A sensitivity analysis. Nat Hazards Earth Syst Sci 19(5):973–984. https://doi.org/10.5194/nhess-19-973-2019
- Wang X, Zhang W, Yin J, Wang J, Ge J, Wu J, Luo W, Lam NSN (2021) Assessment of coastal erosion vulnerability and socio-economic impact along the Yangtze River Delta. Ocean Coast Manag 215:105953. https://doi.org/10.1016/j.ocecoaman.2021.105953
- Ward PJ, Marfai MA, Yulianto F, Hizbaron DR, Aerts JCJH (2010) Coastal inundation and damage exposure estimation: A case study for Jakarta. Nat Hazards 56(3):899–916. https://doi.org/10.1007/s11069-010-9599-1
- Williams AT, Rangel-Buitrago N, Pranzini E, Anfuso G (2018) The management of coastal erosion. Ocean Coast Manag 156:4–20. https://doi.org/10.1016/j.ocecoaman.2017.03.022
- Wolff C, Vafeidis AT, Lincke D, Marasmi C, Hinkel J (2016) Effects of scale and input data on assessing the future impacts of coastal flooding: An application of DIVA for the Emilia-Romagna coast. Front Mar Sci 3:41. https://doi.org/10.3389/fmars.2016.00041
- Xu J, Chen Y (2011) Study of tidal flat reclamation at eastern Nanhui based on RS and GIS. Shanghai Land & Resources 32(3):18–22 (in Chinese)
- Yin J, Yin ZE, Wang J (2012) National assessment of coastal vulnerability to sea-level rise for the Chinese coast. J Coast Conserv 16(1):123–133. https://doi.org/10.1007/s11852-012-0180-9
- Yoon DK (2012) Assessment of social vulnerability to natural disasters: A comparative study. Nat Hazards 63(2):823–843. https://doi.org/10.1007/s11069-012-0189-2
- Zhang X (1998) A discussion on the land formation of Pudong Area in Shanghai. Acta Geogr Sin 53(3):228–237 (in Chinese)
Acknowledgements
We thank the anonymous reviewers and editor for the constructive comments.
Funding
This study was supported by the National Key Research and Development Program of China (No. 2017YFE0107400).
Author information
Authors and Affiliations
State Key Laboratory of Estuarine and Coastal Research, East China Normal University, Shanghai, 200241, China
Xiaoting Wang & Weiguo Zhang
Key Laboratory of Geographic Information Science (Ministry of Education), East China Normal University, Shanghai, 200241, China
Jie Yin, Jun Wang & Jianping Wu
Department of Environmental Sciences, College of the Coast and Environment, Louisiana State University, Baton Rouge, LA, 70803, USA
Nina S. N. Lam
Contributions
Study conception and design were conducted by Weiguo Zhang, Xiaoting Wang and Nina S. N. Lam. Material preparation, data collection and analysis were performed by Xiaoting Wang, Weiguo Zhang, Jie Yin, Jun Wang, Jianping Wu and Nina S. N. Lam. The first draft of the manuscript was written by Xiaoting Wang and Weiguo Zhang and all authors commented on previous versions of the manuscript. All authors read and approved the final manuscript.
Corresponding author
Correspondence to Weiguo Zhang